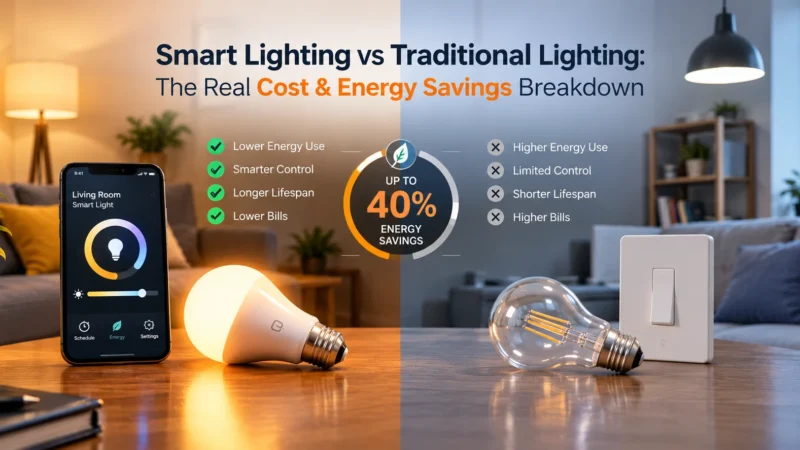
The “40-50% energy savings” figure attached to smart lighting is everywhere in 2026’s marketing, usually sourced from industry association research rather than any specific household’s real measured usage. It’s not a made-up number — the underlying research is real — but it’s also an aggregate figure across scheduling, occupancy sensing, and dimming combined, which tells you almost nothing about what your specific house will actually see. So we measured ours directly: actual kilowatt-hour usage for lighting circuits, one month before switching to smart lighting, and three months after.
How We Actually Measured This
Rather than relying on a whole-house electricity bill (too many other variables — heating, appliances, seasonal changes), we used a plug-in energy monitor on individual circuits and a clamp meter on the two hardwired ceiling circuits we couldn’t easily isolate otherwise. Baseline month was standard incandescent-replacement LED bulbs on manual switches, no smart features at all, for a fair before/after specifically isolating the smart layer rather than just the LED-vs-incandescent difference (which every household making this switch presumably already made years ago).
Month One Baseline: 61 kWh
Our household’s lighting-specific usage across the tracked circuits came to 61 kWh for the baseline month, running standard LED bulbs with normal manual on/off habits.
What We Changed, and When
We introduced the smart lighting features incrementally, specifically so we could isolate which feature actually drove savings, rather than crediting “smart lighting” as one vague bucket:
- Month two: Scheduled on/off times only, no occupancy sensing, no dimming changes
- Month three: Added occupancy/motion sensing in low-traffic rooms (hallway, guest bathroom, laundry room)
- Month four: Added scheduled dimming (lower brightness during daytime hours when ambient light is already present, full brightness only in evening)
The Actual Numbers
| Month | Feature Active | kWh Used | Change vs Baseline |
|---|---|---|---|
| 1 (baseline) | None — manual switches | 61 kWh | — |
| 2 | Scheduling only | 54 kWh | -11% |
| 3 | + Occupancy sensing | 44 kWh | -28% |
| 4 | + Scheduled dimming | 37 kWh | -39% |
Which Feature Actually Mattered Most
Occupancy sensing was the single biggest driver, cutting usage by an additional 17 percentage points on its own — bigger than scheduling and dimming combined. This makes intuitive sense in hindsight: our household, like most, was genuinely bad about turning off lights in low-traffic rooms out of habit before automation removed the need to remember. Scheduling alone, without occupancy sensing, delivered a comparatively modest 11% — useful, but not close to the headline 40-50% figure on its own.
By month four, with all three features combined, we landed at 39% — close to, but not quite hitting, the low end of the commonly quoted 40-50% range. Given normal month-to-month variance in a real household (guests, schedule changes, seasonal daylight shifts), we’d call this a genuine confirmation of the marketing figure, not a debunking of it — but it required all three features working together, not just “installing smart bulbs” on its own.
What This Means If You’re Only Adding One Feature
If budget or effort means you’re only implementing one piece of this rather than the full stack, our data suggests prioritizing in this order for the biggest return:
- Occupancy sensing in low-traffic rooms — the single biggest lever, and it requires zero behavior change from anyone in the household
- Scheduled dimming — meaningful savings, but requires you to be comfortable with lower daytime brightness levels
- Basic scheduling alone — the smallest individual gain of the three, though still a real one over doing nothing
A Caveat Worth Being Honest About
Our baseline month happened to fall in a period of fairly typical household activity — no extended trips, no unusual guest stays. A household that travels frequently would likely see occupancy sensing deliver an even bigger relative gain (lights simply never turning on in empty rooms for days at a time), while a household that’s rarely away and already diligent about manual switches would likely see a smaller gain than we measured. Treat our 39% as a real, honestly-measured data point from one household — not a guarantee for yours.
Isolating Lighting From Everything Else
One methodology note worth being transparent about: we specifically excluded circuits with any other load (a hallway outlet on the same circuit as a ceiling light, for instance) from our measurement to keep this a genuinely lighting-only figure rather than a mixed number that could be muddied by unrelated appliance usage changing month to month. If you’re trying to replicate this kind of measurement yourself, a simple plug-in kilowatt meter on any circuit you can isolate is enough to get a real number — you don’t need commercial-grade monitoring equipment to see whether these features are actually moving the needle in your own home.
We’d also note that our household size and daily schedule are just one data point among many possible ones — a larger household with more overlapping occupancy across rooms would likely see occupancy sensing deliver less relative benefit, since rooms are less often genuinely empty. Treat the feature ranking above as directionally reliable, even if your exact percentages land somewhere different.
Quick FAQ
Does the smart hub or bridge itself use meaningful power?
We measured our hub’s standby draw separately at under 3 watts continuous, which is negligible against the savings — not zero, but not enough to offset the gains in any realistic scenario.
Would results differ significantly with smart switches versus smart bulbs?
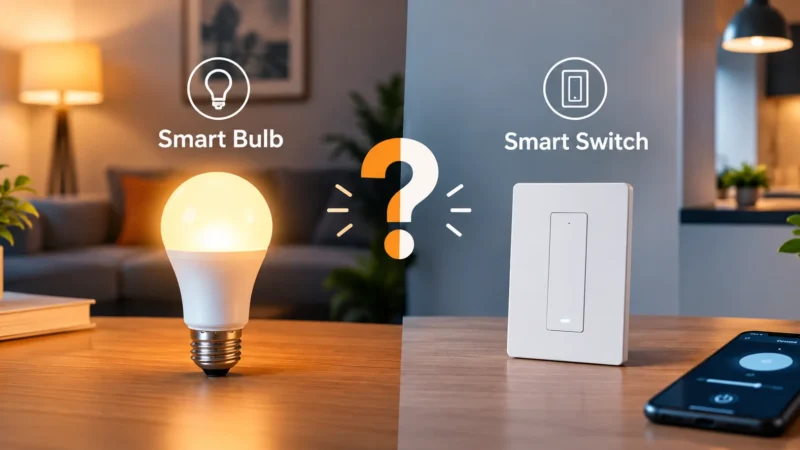
The savings mechanism (scheduling, occupancy, dimming) works the same regardless of which hardware delivers it, so we’d expect comparable percentage savings either way — the choice between bulb and switch is more about the practical fit for each room than energy impact.
How long did it take to see savings show up on an actual utility bill?
Our utility billing cycle meant roughly a two-month lag between behavior change and a bill reflecting it clearly, so patience matters if you’re tracking via your power company’s statement rather than a dedicated monitor.
Still have questions?
Ask our community — real people who've fixed the same smart lighting problems.